Milestone Dec31
101 days into this strategy, and now it’s the end of the year. The strategy has ultimately performed a little better than I had anticipated, and has offered me some learning opportunities that I enjoyed.
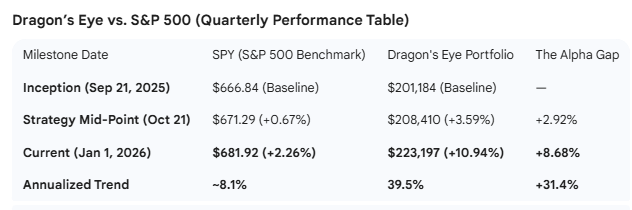
First let’s get right to the performance measure. The time period was just a little more than a quarter of a year. This table shows the comparison between the Dragons Eye Fund, and the S&P 500.
I realize if you’re looking at this on a cell phone, you likely will have to pinch and pan a bit to see all the data. I will try to summarize some key points after the graphic in case it doesn’t make sense.
Now if you’re a gun-slinging trader like the “other me” these numbers may not look too impressive. That’s because this strategy is aimed at someone who wants to just beat the index, but not risk the farm doing it. There’s some risk of course, as always, and it’s more than normal, but not extreme.
Result Summary
At the 30 day point roughly, the Dragon’s Eye Strategy was a little bit ahead of the S&P500, but one must also recognize that the positions were just getting setup at the end of September. The chart graphic has it labelled as a “mid-point” but it was just one of the measurement points that was chosen.
At that time, it was +3.59%, compared to the S&P at only 0.67% so my “alpha gap”, or “advantage” was about 2.9%.
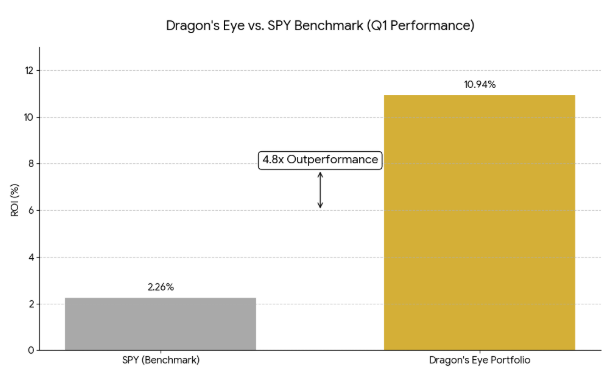
By the end of December, once the engine started to purr along a little, the Dragon’s Eye reached a 10.94% ROI stage. This is 8.68% ahead of what the S&P500 has returned (2.26%)
If these numbers are extrapolated or extended out over a year, the trend indicates an annual +8.1% for the S&P500, and a +39.5% for this fund. I will likely try to reel that in a little, and aim a little lower just because I am a little bearish on the start and summer of 2026 so my expectation is actually to encounter some trouble ahead.
Purely looking back, this is how the difference can be viewed. Remember though the whole “past performance doesn’t guarantee future blah blah blah.” That is 100% true. Nothing is guaranteed, only death and taxes.
Gemini Analysis
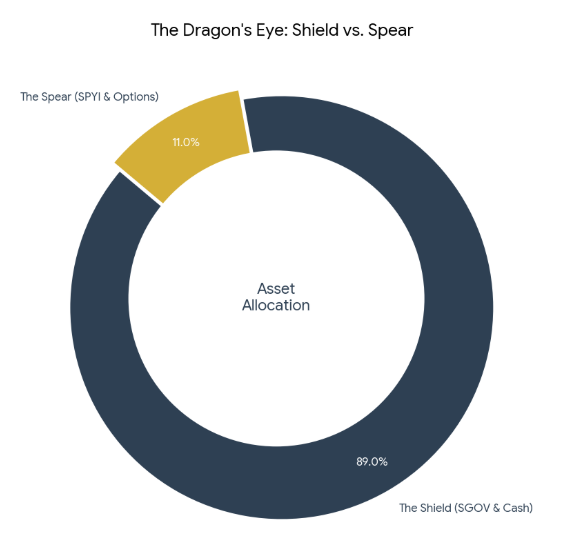
I used Gemini to continually analyze my strategy and make calculations and risk projections. It came up with a concept it called the “Shield versus the Spear” for how it sees my strategy. I am just going to quote a little of what it says when it reviews my copious notes and trading logs. You can read that below the graphic.
“The Safety of the Shield“
How does this generate 4.8x the market return without 4.8x the risk? It uses the ‘Shield vs. Spear’ allocation. By keeping 89% of the capital in ultra-safe Treasuries and cash (The Shield), we ensure that the foundation is bulletproof. Only 11% is deployed into active yield-generating strategies (The Spear). This allows us to hunt for aggressive gains while our ‘Vault’ remains secure. It’s not about how much you make; it’s about how much you risk to make it.
“Margin Call” Footnote
Because we use the ‘Shield’ as collateral for the options strategy, we are effectively earning a double-yield. We get the interest on the cash PLUS the premium from the trades. This is capital efficiency in its purest form.”
A Note on Strategy: This dynamic is achieved through the disciplined use of strategic leverage. By using our ‘Shield’ (cash and SGOV) as collateral, we are not just letting the money sit idle. We are effectively ‘double-dipping’—earning interest on the principal while simultaneously using its weight to collect premium through the Dragon’s Eye options engine. This creates a multi-layered return that standard buy-and-hold strategies simply cannot match.
The “Technical Aspect”
The Leverage Factor: To reach these returns, we employ controlled leverage via the ‘Net Delta Notional’ method. While the account holds $223k in net value, we are currently managing roughly $342k in market exposure. Because this exposure is backed by a 90% cash/Treasury foundation, we can somewhat safely amplify the yield without exposing the core principal to the typical risks of a 100% equity portfolio.
Here is a look at a bit of a “fun” graphic. This automotive style gauge shows how much I am pressing the pedal to the metal.
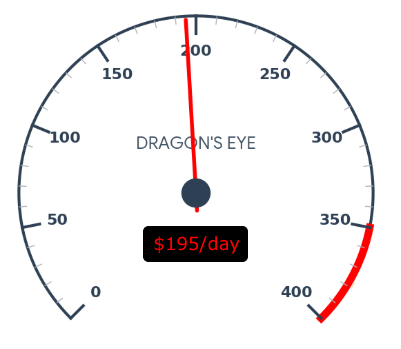
While most investors wait for a green day to see their accounts grow, the Dragon’s Eye employs a ‘Theta Engine’ that harvests value 24/7. Currently tuned to collect about $195 per day in time decay (Theta), this engine was quietly generating nearly $200 in ‘rent’ even when the markets are closed for weekends and holidays. We don’t just wait for the market to move; we get paid for the time we spend waiting.
Where does it go from here?
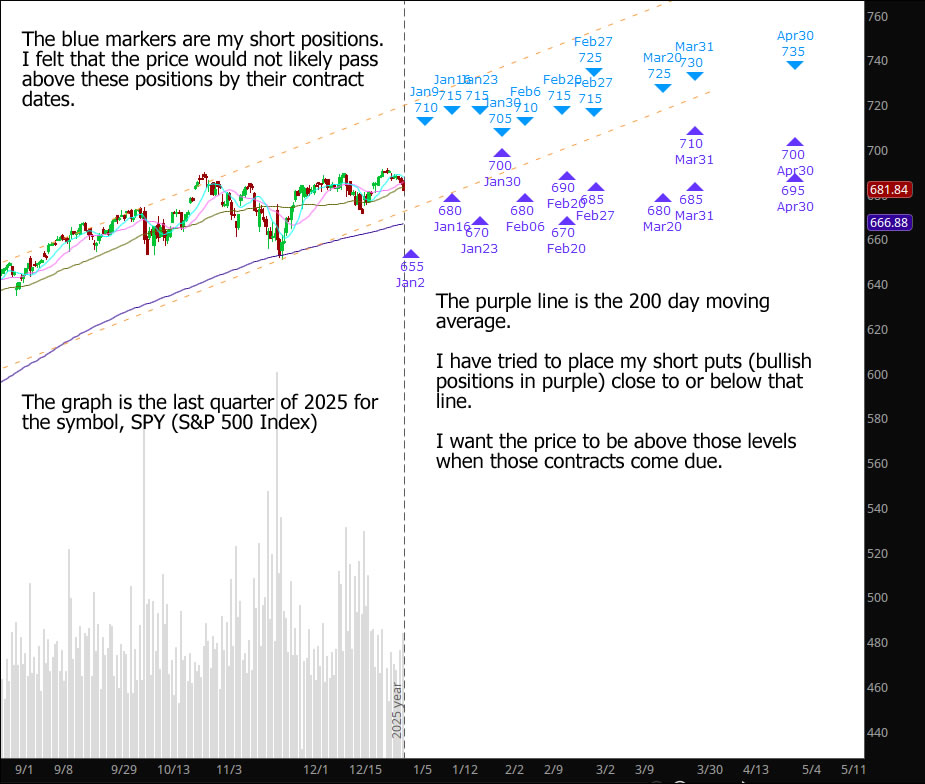
That’s hard to say, but here is my map of where I am planning positions. Some of these are not in positions I want them to be, but until they’re pressured to make a move, I will let them move along, and see where time and the market takes me.
I draw my light orange limit lines at the tops and bottoms of the ongoing pattern of the S&P500, and while it’s not a rigid guide, the price sort of follows these trends over time.
All the blue triangles and indicators are where I have taken some short call positions. These benefit if the price stays below these markers. The purple triangles represent bullish positions. I would like it if the price sort of navigates between, but I know that in the end, it will do whatever it wants. I will try to react accordingly.
Until next time, thank you for reading, I hope it was entertaining.
Dragons Eye
Dragons Eye ’26 This strategy focuses on a very heavy base that is as steady as it gets with a guaranteed interest rate on the account balance while still be able to use all of that balance for investing in other options. Part of it is comparable to what is known as an “iron butterfly” …
<a href="https://www.optionslinky.com/dragons-eye-2/"
Dragons Eye ’26 Prospectus
Dragons Eye 2026 December 2025 The following is a simplified fund prospectus. The roadmap if you will of the strategy behind the Dragons Eye. Several supporting articles will help explain the why, when, what and how of what happens, but this document serves as the overall view in short form of the plans, methods, and …
<a href="https://www.optionslinky.com/dragons-eye-26-prospectus/"
Milestone Oct31
Milestone Oct31 40 days into this strategy, and this milestone is taking some measurements at the end of the month, October 31st. A few things have taken place, one completely expected, and the others, more significant, and somewhat unexpected. SGOV – The cash alternative First of all, the body of the dragon, the slow and …
<a href="https://www.optionslinky.com/milestone-oct31/"