
Milestone Oct31
40 days into this strategy, and this milestone is taking some measurements at the end of the month, October 31st. A few things have taken place, one completely expected, and the others, more significant, and somewhat unexpected.
SGOV – The cash alternative
First of all, the body of the dragon, the slow and steady production of cash has behaved as we thought it would. The SGOV component made up of purely government bonds produced $757 in slow and steady income for October, and $1387 over the 40 days. This represents a 0.69% return, which would track to be about about 6.29% annually. I had been expecting about 4% return on this, so I think this is abnormal. It’s likely we might see this percentage dwindle over time due to falling interest rates. We have to remember, we don’t expect much return on this part because it’s basically only being used as a parking space for cash, and so anything it produces is better than 0 – 0.5% which is what cash normally can produce.
SPLG – Original S&P500 Tool
During the month of October, I began to realize that the options for SPLG have some inflexible aspects to them. First of all, I noticed that future target dates are not as readily available as I originally thought. And secondly, I noticed that pricing on the options was sometimes not as competitive as I expected during surges and dips. Since I still want this entire strategy to be based on the S&P500 companies, I looked for other funds that might have more liquidity, more action, and therefore more competitive pricing on the options. I saw several, all of which have high stock prices making them a bit more difficult to wield, but the trade offs with flexibility on dates and better pricing offset that too much to ignore.
SPY – SPDR S&P 500 ETF
“The trust seeks to achieve its investment objective by holding a portfolio of the common stocks that are included in the index, with the weight of each stock in the portfolio substantially corresponding to the weight of such stock in the index.”
Ok, this is exactly what I was looking for when I chose SPLG, but with this instrument, I will have to only be trading 1 or 2 options on specific dates rather than grouping bunches of 4 or 8, and in multiple positions. That sounds like simplifying, and it is, however I will have to learn how to pick the price targets a little more prudently to avoid being on the wrong side of the price as time goes by.
Transition – Over the last few weeks of October, I simply closed any SPLG positions, and immediately opened a position in SPY that reflected more or less the same risk, the same premium, but with a smaller option count at each point in time.
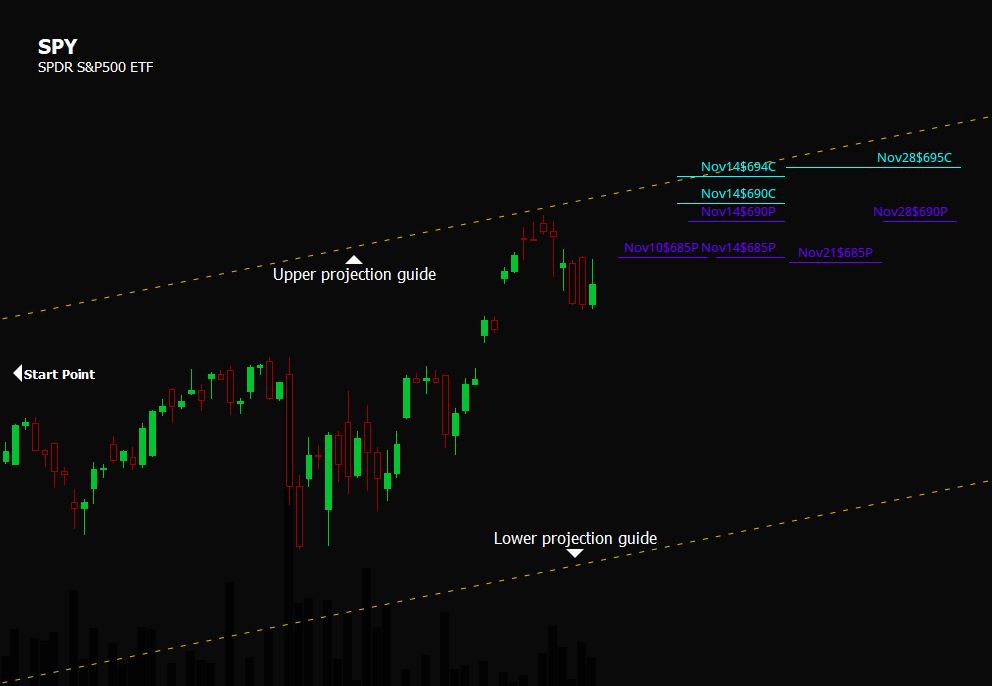
The last 40 Days charted appear below. I have my short PUT positions (bullish) in purple, and the short CALL positions (bearish) in cyan. These are just the active and open positions for November. The future positions are setup, but we can look at them on another post.
Results Oct 31 – 40 Days
Here are the numerical results after 40 days of all the components of the Dragons Eye strategy.
| Component | Profit/Loss | % Gain/Loss | Projection |
|---|---|---|---|
| SGOV (cash) | +$1,387 | +0.69% | +6.29% |
| SPLG/SPY | $8,252 | *Realized Gains | |
| Open Options | -$3,292 | #Waiting for closure | |
| Overall Return | $5,562 | +2.76% | +25.2% |
* Realized gains come from option contracts that have been closed, and realized their gain or loss. This is the total of the gains/losses for the 40 days that have gone by.
# The open options waiting to be closed almost always are “in the red” because we’re waiting for time to decay the value of the short options. As time goes by, these options normally turn from red to green as the expiry date gets closer.
The overall return is a snapshot of a value in time. It won’t correlate directly to the math of realized gains and open positions because they’re constantly changing. This figure is taken from the actual account value, and comparing it to the original account value from the start date to arrive at a percentage calculation. I am surprised by the 2.76% gain in such a short time. That projects out to 25.2% over a year, but I fully expect that to be reduced as more time goes by. Our 40 day period is not yet enough to be confident in any projections.
November Action
Take a look at how November is shaping up.
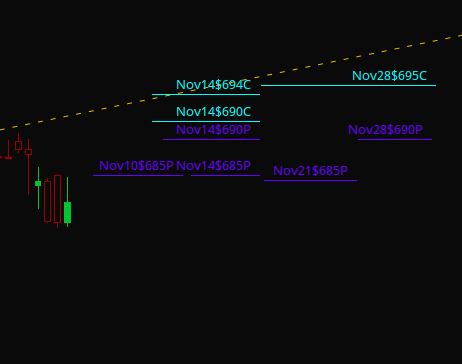
November Option Expiries
Let’s breakdown the chart a little, and zoom into the positions that are coming up for expiry this month. Purple positions are bullish short PUTs, and would benefit from higher prices, Cyan positions are short CALLs that benefit from the price not surpassing their limits.
Nov10$685 short PUT
The initial premium credit for this option was $629. November 10th, a Monday, is now only about 8 days away. Should the price be close to $685, we will count this as a win. When it expires, my plan is to resell it as far away as Feb 27th, and as high as $700. There are still 8 days left to see how things work out though, so while that’s the plan, you know what they say about counting chickens.
Nov14$685 short PUT
The initial premium credit for this option was $769. This is a Friday expiration, which is normally what I will be aiming for. Originally this was positioned lower, but I raised it to hedge the short positions at $690 and $694.
Nov14$690 short PUT
Initial premium credit – $991. This was also positioned lower originally, but I pulled it upward to hedge the short positions.
Nov14$690 short CALL
Initial premium credit – $277. As of Oct31, this has a delta of about 0.34▼ which is only about a 33% chance of hitting. This however is why I raised the PUT positions.
Nov14$694 short CALL
Initial premium credit – $193. On Oct31, the delta was 0.25▼ a little more comfortable than the other short position, but still within dangerous levels.
Nov21$685 short PUT
Initial premium credit – $828. 20 days away, lots of things can happen.
Nov28$690 short PUT
Initial premium credit – $1,059. This will be the last expiry of November. I hedged this with a short call at $695.
Nov28$695 short CALL
Initial premium credit – $324. The short call didn’t bring in as much credit as the short put. Time will tell if this was a wise move or not. Indicators say it has a 32% chance of being touched.
That’s it for the month of November. There’s a total of about $5,070 of premium that was sold. Some of that we’re going to have to spend to close the contracts, the plan is to see how much of it can be kept, and converted into “realized gains” which ultimately turn into total gains eventually.
I am not sure if a mid-month report is warranted or not for this. If not, then I will report again at the end of November and see if the strategy is still on track.
Burn and Learn The title of this article is Burn and Learn for a reason. The Dragon’s Eye definitely endured some heat this quarter. The wings got burned a little, as did the tail. The Eyes are still intact though, and the Dragon’s Eye is ready for what come next. This experiment is now 221 …
<a href="https://www.optionslinky.com/burn-and-learn/"
Milestone Dec31 101 days into this strategy, and now it’s the end of the year. The strategy has ultimately performed a little better than I had anticipated, and has offered me some learning opportunities that I enjoyed. First let’s get right to the performance measure. The time period was just a little more than a …
<a href="https://www.optionslinky.com/milestone-dec31/"
Dragons Eye
Dragons Eye ’26 This strategy focuses on a very heavy base that is as steady as it gets with a guaranteed interest rate on the account balance while still be able to use all of that balance for investing in other options. Part of it is comparable to what is known as an “iron butterfly” …
<a href="https://www.optionslinky.com/dragons-eye-2/"